
Within the global warming observed in the 20th century, how can we distinguish between natural causes and human activity?
Assessing the respective contributions of natural factors, on the one hand, and human activities, on the other, directly raises the question of demonstrating and quantifying a cause-and-effect relationship, the effect in this case being ongoing global warming.
From this point of view, the study of climate, particularly on a global scale, is quite singular. Usually, in experimental science, causal links are discussed and established on the basis of experiments. For example, the efficacy of a drug is demonstrated by giving it to one set of individuals suffering from the same pathology, while another set receives a placebo. This approach enables direct measurement of the drug’s effect.
The same approach, transposed to the study of climate, would require us to have a certain number of planets on Earth, to impose on half of them a gradual, unnatural increase in greenhouse gas concentrations, as well as a few other anthropogenic disturbances, to impose on the other half the observed variations in solar activity, as well as a few volcanic eruptions in due course, and to take stock of the warming observed after a hundred years or so. As such an approach is, of course, quite impossible to implement, climatology has had to look for alternatives to the experimental approach.
The first, and certainly the most important of these alternatives, is to actually carry out this type of experiment, but on a virtual Earth, i.e. via digital simulations, rather than on improbable twin planets. This approach is based on our understanding of the various physical processes at work in the climate system, and our confidence in the ability of numerical models to faithfully reproduce the major mechanisms of climate. For example, a precise understanding of the radiative role of greenhouse gases can quantify the warming caused by the observed increase in their concentrations.
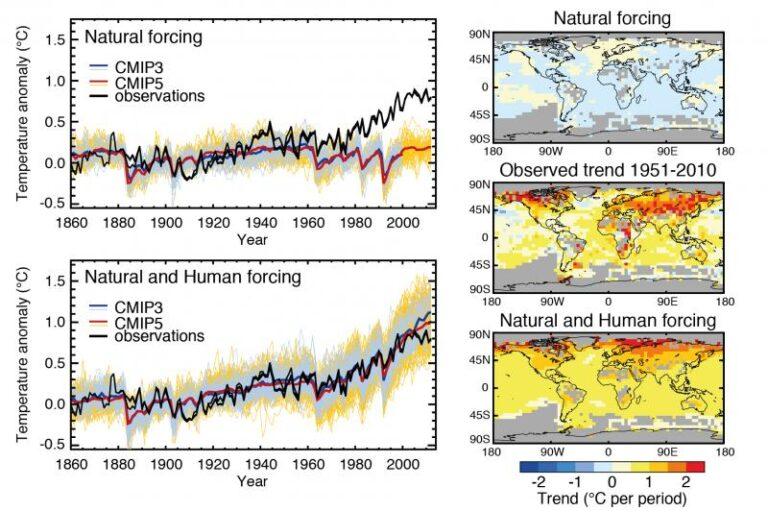
To coincide with the latest IPCC report (2013), a number of modeling centers carried out simulations dedicated to this issue. The results of these simulations are illustrated below in terms of global mean annual temperature. The simulations illustrated above (“Natural forcing”), first of all, are carried out by imposing on the “virtual planet” only the observed variations in natural forcings (in particular, variations in solar activity and major volcanic eruptions). There are no greenhouse gas emissions, nor any other disturbances linked to human activity. The simulations illustrated below (“Natural and Human forcing”) are carried out by imposing on the climate system the full range of disturbances known and understood to date, i.e. both anthropogenic and natural disturbances.
This figure illustrates several results. Firstly, each of the two categories of forcing considered has played a role in the variability of the planet’s mean temperature over the past century (on the left of the figure). Major volcanic eruptions, for example, are responsible for cooling that lasts a few years.
Secondly, the two sets of simulations differ markedly at the end of the period and, in particular, the average warming observed during the second half of the 20th century is not reproduced when natural forcings alone are taken into account.
Thirdly, in terms of warming over the century as a whole (between the beginning and the end of the period), the effect of anthropogenic forcings (or human activities) is largely dominant, and the contribution of natural forcings is small. It should be noted that the results vary, from one simulation to another and (not explicitly shown in this figure) from one climate model to another.
The three conclusions quoted above are, however, largely robust to these uncertainties. Finally, beyond variations in global mean temperature, the spatial distribution of observed warming (right) is also much more consistent with all forcings than with natural forcings alone.
A second possible alternative is to use the climate history of the only planet Earth available to try and assess how each external forcing influences the climate. There are many difficulties in this approach: very old observations (known as paleoclimate) are less precise than those available in the 20th century, the main external forcings at work over long periods of time are not necessarily the same as those during the 20th century and, above all, there is no historical precedent for the emission of large, unnatural quantities of greenhouse gases into the atmosphere.
For these reasons, it remains relatively arduous to establish statistically, from historical observations alone, the respective contributions of natural and anthropogenic forcings over the past century. The information derived from this type of analysis, however, is consistent with the previous conclusions.
A third alternative, complementary to the first, is to use statistical tools to compare the results of climate simulations with recent observations. This involves discussing the statistical robustness of the results, assessing the presence of any inconsistencies between simulations and observations and, in many cases, re-evaluating the respective contributions of different forcings on the basis of observations.

Different strategies and statistical techniques can be considered in such an approach. One of them has been widely used by the scientific community. It consists in assuming that climate models correctly assess the spatio-temporal distribution of climate change, even if they fail (potentially) to reproduce the correct amplitude.
For example, a robust characteristic of warming linked to greenhouse gases is that it is more pronounced over continents than over oceans, and stronger at the end rather than the beginning of the 20th century, linked to higher atmospheric concentrations. On the other hand, the amplitude of the corresponding warming is not assumed to be known and is assessed statistically, based solely on observations.
The main results obtained with this type of method, and described in the latest IPCC report (2013), are illustrated in the figure below, which shows the estimated contributions of the main forcings to global warming over the period 1951-2010.
First of all, it can be seen that the contributions of natural forcings and internal variability to the observed warming (around 0.65°C over the period) are small. Most of this warming is therefore attributable to anthropogenic forcings (0.6 to 0.8°C).
On the other hand, the warming induced by greenhouse gases (0.5 to 1.3°C) has been partly masked by the effect of other anthropogenic disturbances (foremost among which are aerosol emissions; -0.6 to +0.1°C) in proportions that are still relatively uncertain. This uncertainty explains the width of the GHG and OA confidence intervals, while the sum of these two terms (ANT) is relatively well constrained.
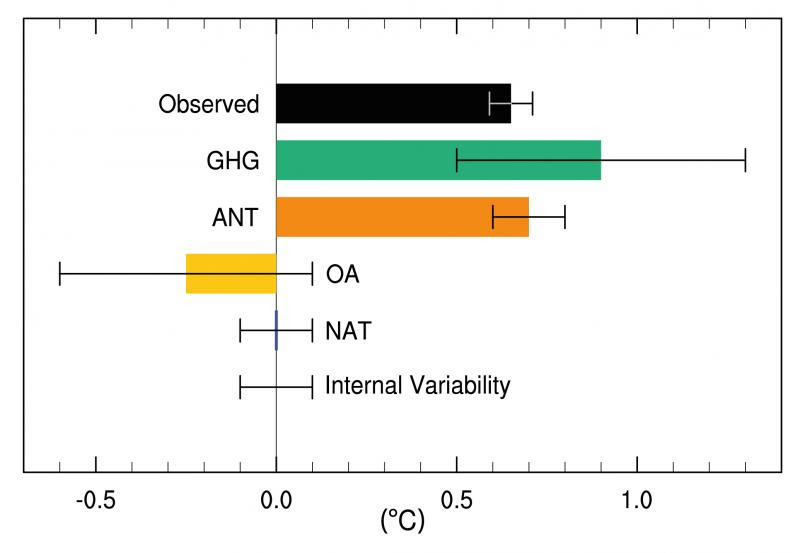
ESTIMATED CONTRIBUTIONS OF DIFFERENT FORCINGS TO OBSERVED CHANGES IN AVERAGE TEMPERATURE OVER THE PERIOD 1951-2010Sources: Figure taken from IPCC 5th Assessment Report (IPCC, WG1, Chapter 10, Figure 10. 5)Estimated likely contributions of anthropogenic greenhouse gases (GHG, green), other anthropogenic forcings (OA, yellow), all anthropogenic forcings (ANT, orange), natural forcings (NAT, blue), and Internal Variability (IV) to observed changes in global mean surface temperature. Observations (HadCRUT4) are shown in black, with a range of values describing the uncertainty of the measurements.
https://www.climate.gov/maps-data/climate-data-primer/predicting-climate/climate-forcing


