
Climate Forcing
This indicator measures the “radiative forcing” or heating effect caused by greenhouse gases in the atmosphere. Radiative Forcing...

Links between climate change and sea surface temperature
This indicator describes global trends in sea surface temperature. This graph shows how the average surface temperature of...

The link between ocean warming and climate change
This indicator describes trends in the amount of heat stored in the world’s oceans. This figure shows changes...

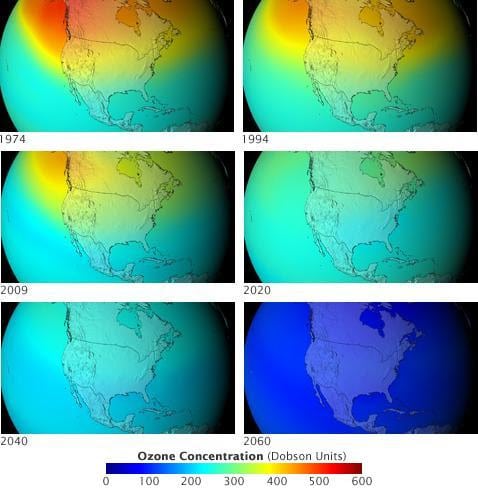
Presentation of the Montreal Protocol
All international bodies concerned with climate change agree that the best way to control HFCs is to progressively...
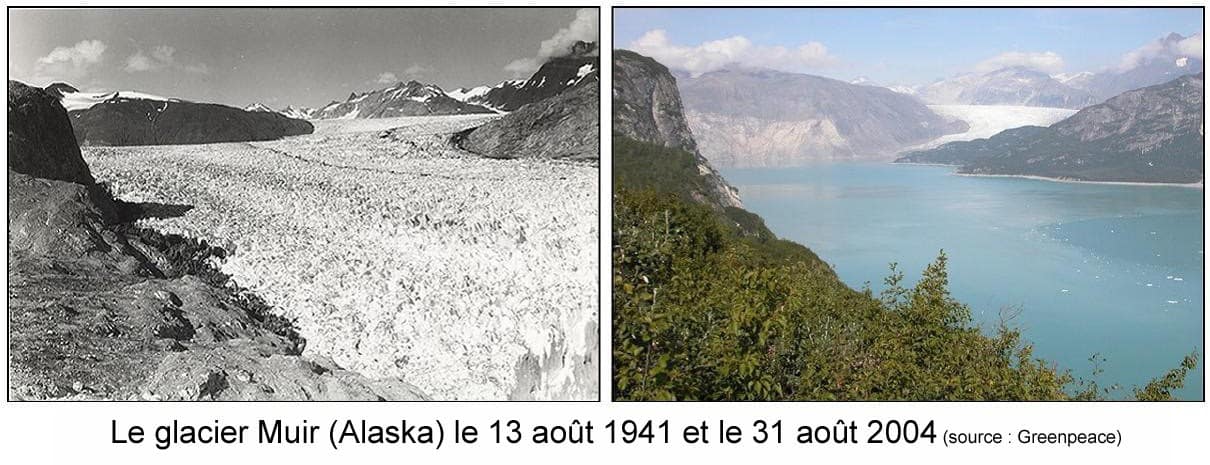
Glaciers in danger
The latest IPCC report published in 2013 confirms that ice caps and glaciers are losing mass almost everywhere...
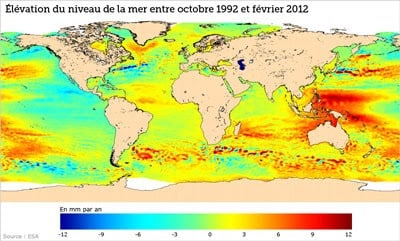
Oceans in crisis
According to the latest GEIC report (2013), average sea levels rose by 19 cm between 1901 and 2010....

Possible scenarios for global warming in Europe
The projected mean annual global surface temperature is set to rise by the end of the century (2071-2100...
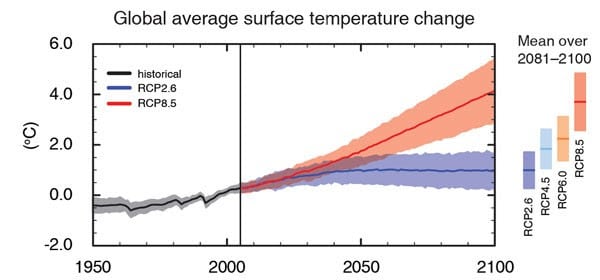
Global warming is going to be even more powerful
Scenarios for average global warming between now and 2100 depend largely on the emissions scenarios considered. The Intergovernmental...
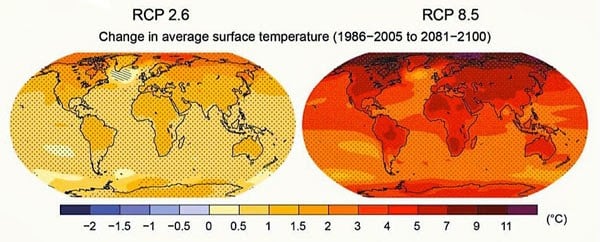
Tables of mean surface temperature changes (1986-2005 to 2081-2100)
This table gives us 2 extreme IPCC possibilities (the most [RCP2.6] and the least [RCP8.5] ambitious in terms...
