The future climate will certainly not be a simple extrapolation of current climatic variations. The main reason for this is that human activity, via greenhouse gas emissions, is seriously disrupting the planet’s energy balance. This disruption affects the main processes governing the dynamics and thermodynamics of the atmosphere, ocean, continental surfaces and their interactions.
Simple extrapolations of what we have known to define the future climate are therefore risky. The laws of physics and simple models of energy equilibrium indicate that if we increase the greenhouse effect, the global temperature rises, setting in motion elementary feedbacks such as that of humidity in the atmosphere, which reinforces the increase in the greenhouse effect and, hence, warming. But beyond this statement, what more can be said?
As scientific progress continues, it is no longer simply a question of knowing the main average characteristics of the climate, but also of foreseeing changes in climate variability from one year or decade to the next, identifying possible changes or increases in the frequency of extreme climatic events or events strong enough to have repercussions on society, or highlighting possible risks of breakdown in the way the climate works.
Climate models have become essential forecasting tools. The three-dimensional representation of the planet’s energy processes, heat and water transport, and the interactions between climates and biogeochemical cycles make it possible to characterize climate and meteorological events according to different scenarios.
For example, it is possible to study whether, in a warmer climate, the low-pressure passages that bring precipitation from the Atlantic Ocean over France will follow the same routes as at present, and whether the associated precipitation will be more or less intense. Models can be used to carry out numerous numerical experiments to test the influence of different disturbances.
What happens if we double the carbon dioxide (CO2) content of the atmosphere? What happens if we increase fine particle emissions? What happens if we use land for agriculture, reducing areas of natural vegetation? Models thus offer numerous possibilities for exploring global, continental and even regional climate characteristics.
This exploratory aspect is reflected in the expression “climate projection”. The word “projection” serves to remind us that the results depend on the assumptions made about climate disturbances. The corresponding simulations are therefore by no means realistic, but serve to stimulate reflection and understanding of how the climate evolves in different contexts.
The credibility of the results comes from an understanding of how physics works, and the ability of the models to represent the main processes governing climate dynamics and thermodynamics.
Assumptions and projections
From the point of view of climate, it is not the quantity of greenhouse gases emitted into the atmosphere that is directly important to its functioning, but the way in which these gases modify the planet’s energy balance. This energy disturbance, or radiative disturbance, is measured by the radiative imbalance induced at the top of the atmosphere (radiative forcing), which is the reference variable for measuring the impact of human activity on the climate. In practice, different combinations of anthropogenic factors can lead to the same global radiative disturbance. This is the basis for the set of simulations in the international CMIP5 project
CMIP5 (Coupled Model Intercomparison Project – Phase 5) is a project coordinated by the World Climate Research Programme. This project provides protocols for comparing the results of numerical experiments on past, present and future climates using different models, within a relatively constrained framework. The various studies and scientific publications associated with this project served as the basis for the fifth IPCC report, whose publications served as a reference for the fifth IPCC report.
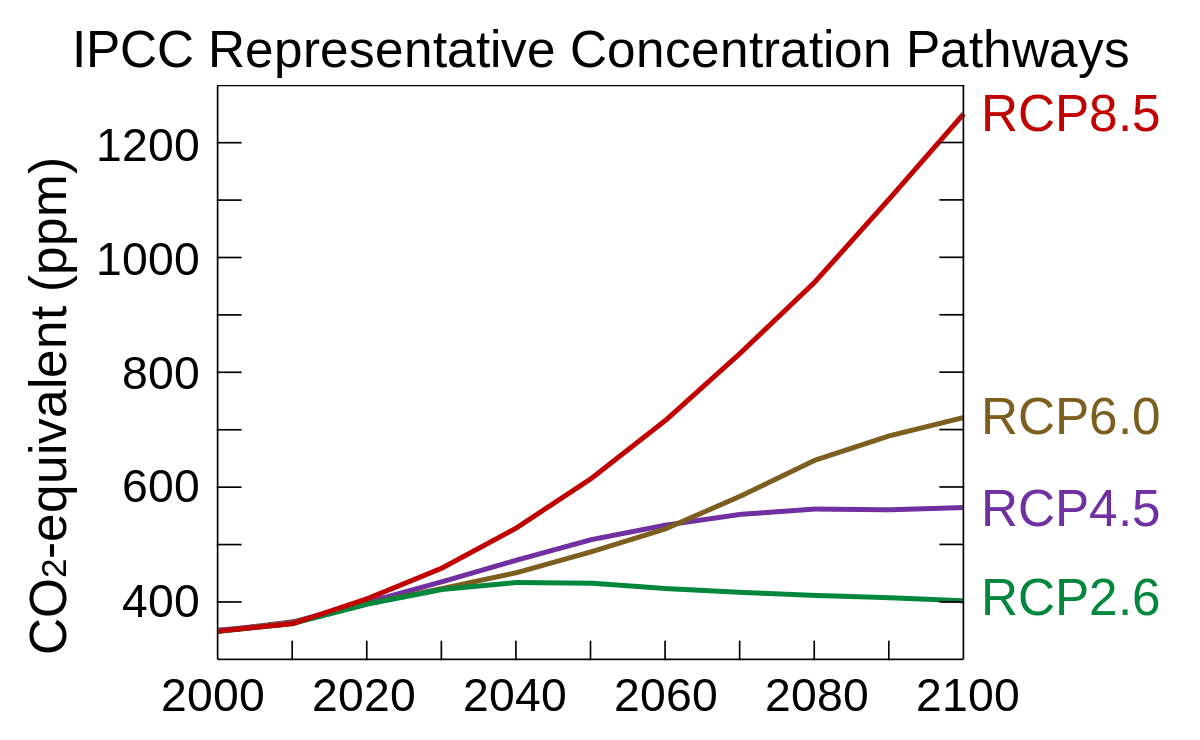
Figure 1 shows the evolution of radiative disturbance for different trajectories of greenhouse gas concentrations in the atmosphere (RCPs, Representative Concentration Pathways). These four RCPs define different possible magnitudes of radiative disturbance (in W/m2) by 2100. RCP 8.5, for example, indicates a disturbance of 8.5 W/m2 compared with the pre-industrial period (1860).
Note that, as CO2 is a long-lived gas, maintaining a constant concentration in the atmosphere implies a reduction in emissions. The RCP 2.6 scenario implies significant reductions in greenhouse gas emissions. It has been designed as a scenario that would keep the global temperature increase below 2°C with a good probability, 2°C being the temperature threshold used in international climate negotiations. These four options are derived from a much broader set of integrated climate-economic models.
By determining the levels of greenhouse gas and aerosol emissions (or associated atmospheric concentrations), as well as the characteristics of agricultural surfaces that would lead to the radiative perturbations of RCPs, these models make it possible to rapidly explore the major consequences of our GHG emission orientations. It is the GHG and aerosol emission levels, the characteristics of agricultural surfaces, etc. calculated by these climate-economy models that are imposed on the climate models to characterize the climate trajectory of each RCP.
Although models are constantly improving, they do not realistically represent all facets of the climate. The uncertainty due to the way models are built can be characterized by considering the same simulations carried out with a set of different models. The most recent results from the CMIP5 project come from around forty models developed by some twenty modeling groups.
What kind of world in 2100?
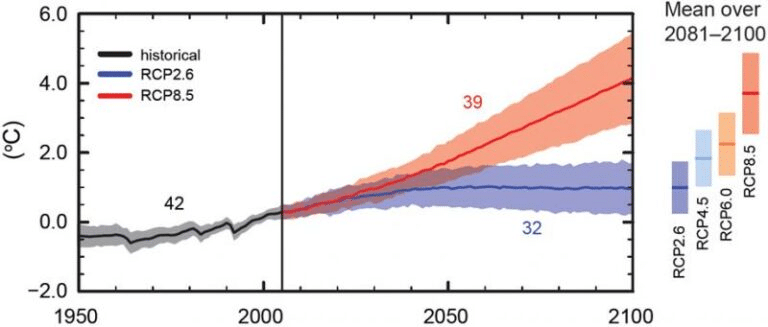
In all cases, the future trend shown in Figure 2 is marked by an increase in global temperature, with a marked contrast in 2100 depending on the socio-economic hypothesis adopted. Thus, the summary of the various publications presented in the 5th IPCC report indicates that, taking the period 1986-2005 as a reference, the RCP 8.5 scenario leads to a warming of between 2.6°C-4.8°C. For RCP 2.6, the most likely estimate is between 0.3°C-1.7°C.
This scenario is the only one that keeps temperatures below the 2°C threshold compared with the pre-industrial period, given that the temperature increase was 0.7°C-0.8°C between the pre-industrial period and 1986-2005.
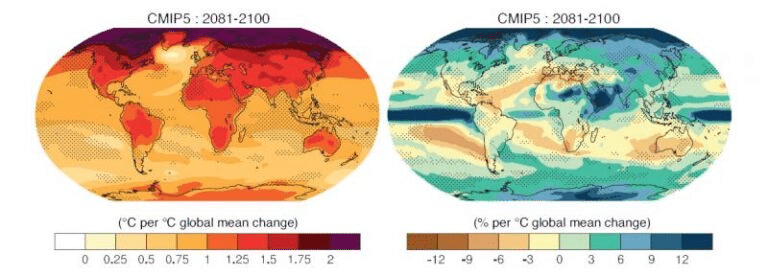
This rise in temperature is associated with an overall increase in atmospheric humidity of around 7% °C-1 (7% per degree of temperature rise), in accordance with Clausius-Clapeyron’s law, which regulates the amount of water in the atmosphere as a function of temperature. The increase in precipitation is estimated at 1-3% °C-1 for RCP 4.5, RCP 6 and RCP 8.5, and 0.5-4% °C for RCP 2.6.
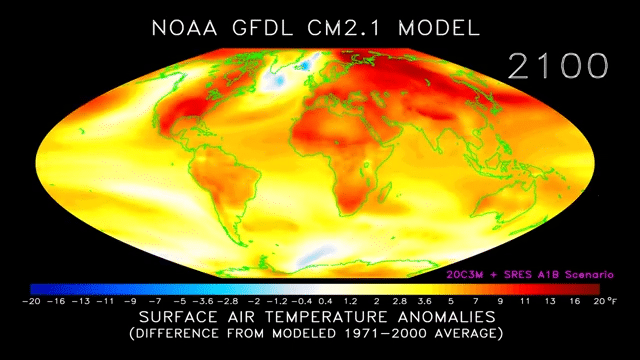
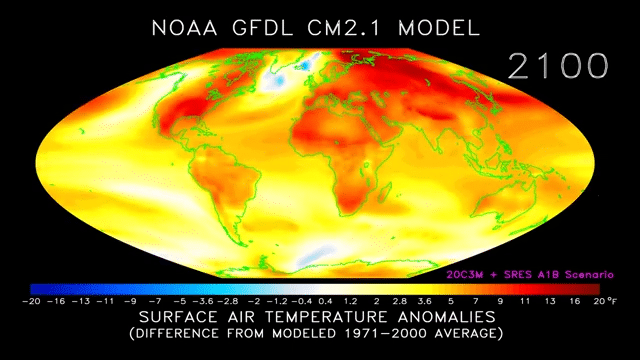
The geographical distribution of these global changes shows marked regional variations (Figure 3). Temperature changes are 1.4 to 1.7 times greater on land than in the ocean. A similar factor is estimated from numerical simulations of the last glacial maximum, for which the global temperature change is of the order of 3-6°C.
This factor is confirmed by the climate reconstructions, which allows us to verify both the credibility of the reconstructions and the ability of the models to represent climates different from the current one. Warming is also more marked in the Arctic.
In Antarctica, this phenomenon of polar amplification is less prevalent than in the North because, due to the strong zonal circulation and strong vertical mixing in the Circumpolar Ocean, heat is distributed at depth and surface waters warm less, thus slowing the melting of ice-covered surfaces.
It should also be noted that the current rate of warming is much faster than that of the last deglaciation. A warming amplitude comparable to that of the last transition between a glacial and interglacial climate is projected in 100 years for RCP4.5 and RCP6.0, whereas it occurred in 10,000 years during the last deglaciation.
The global average for precipitation also masks major geographical disparities between regions seeing an increase in precipitation and regions drying out (Figure 3). Precipitation is likely to increase in mid-latitudes, due to increased atmospheric humidity and moisture transport from tropical regions. On the other hand, arid zones in the tropics and subtropics, as well as certain mid-latitude regions (such as the Mediterranean), are likely to see a decrease in precipitation.
Strong or extreme events generally have a strong impact on the environment and society, and warrant dedicated analyses. An example is provided in figure 4 for precipitation. In line with our understanding of how the atmosphere works, an increase in intense precipitation is expected in a warmer climate. Tropical regions, where the most intense convective systems are already developing, will be hardest hit. It should also be noted that even regions where the number of dry days is expected to increase may also be affected by more intense precipitation events, such as around the Mediterranean.
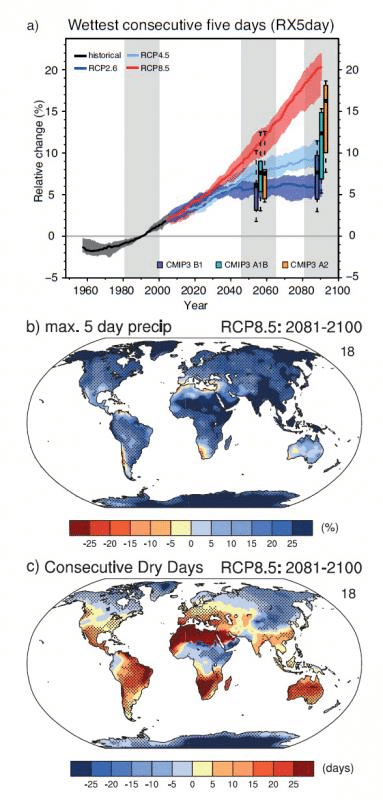
Simulated relative changes with respect to the 1981-2000 period a) and b) in the annual maximum cumulative precipitation over 5 days, in % and c) in the number of consecutive dry days (precipitation rate less than 1mm), in days. For panel a, the envelopes give an indication of the dispersion between the results of the different models. The vertical bars on panel a indicate that the results obtained for intense precipitation trends are similar to those reported in the 4th IPCC report for slightly different scenarios. The maps show major regional disparities. In the tropics, these disparities are linked to changes in monsoon patterns and dry season length.
These changes are associated with changes in atmospheric and ocean circulation, and have implications for the melting of ice-covered regions and rising sea levels. One point to bear in mind, however, is that by 2100 the choice of scenario, which is a matter for political decision, is the main factor determining the extent of climate disruption.
The results also indicate that, in order to meet the constraints of the low-emissions scenario (RCP 2.6), the natural carbon sinks of the ocean and continental surfaces will not be sufficient to absorb anthropogenic carbon emissions. Following this scenario implies that anthropogenic emissions will have to be drastically reduced to stay below the 2°C temperature rise by 2100 compared with the pre-industrial climate.

