

It is very important to note that the radiation emitted by the Sun alone represents more than 99.99% of the energy contribution to our terrestrial environment. What could be more normal than making it responsible for climate change?
Yet the Sun has long been a symbol of immutability. So much so that the radiated power throughout the spectrum (called total irradiance) is still called the solar constant. It took until the beginning of the space age to realize that this constant varies. However, its relative variation over an 11-year solar cycle hardly exceeds 0.4, which is far too small to account for the temperature variations observed on Earth. The debate is raging today to find physical mechanisms that can amplify such variations.
We must mention that the mechanisms commonly invoked, there, is the absorption of certain wavelength ranges of the solar spectrum. The contribution of the Sun cannot be reduced to that of total irradiance, because the different wavelengths of the spectrum differ greatly in variability and impact on the atmosphere: ultraviolet radiation in particular, whose contribution to total irradiance is only 8%, but whose variability can easily exceed 10% over a solar cycle. The absorption of this radiation in the upper stratosphere changes the ozone concentration, which in turn affects the radiative balance of the Earth. The most energetic part of the solar spectrum is absorbed in higher altitudes, where the relative variations in environmental conditions (density, temperature) are even greater. However, it remains to be seen how these variations could be effectively coupled with the lower layers of the atmosphere.
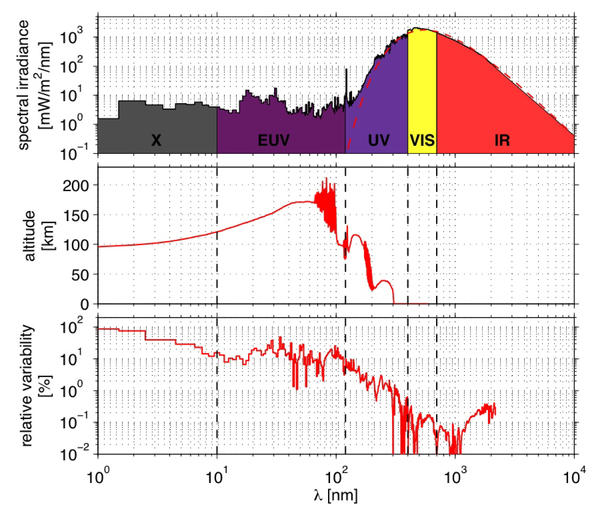
Mean solar spectral irradiance (top figure), with the altitude at which it is mostly absorbed (middle figure) and its relative variability over a solar cycle (bottom figure). This figure is based on 7 years of measurements by the SORCE and TIMED satellites. The red curve in dashed lines on the top figure represents the emission spectrum of a 6000° black body.
There are other avenues that invoke in addition to electromagnetic radiation, but the much more tenuous effect of the solar magnetic field or the flux of matter emitted by the Sun. The physico-chemistry of the upper atmosphere, for example, is influenced by the global electrical circuit associated with the Earth’s magnetosphere, which is in turn affected by the solar wind. Another track, very controversial, uses cosmic radiation. The latter consists of very high-energy particles and its flux is modulated by solar activity; by its action on nucleation processes in the atmosphere it could influence the rate of cloudiness. All these mechanisms are coupled, and it is very difficult to isolate their contribution.
The role of the Sun on climate is undeniable today; the omnipresence of the 11-year period in multiple climatic data attests to this. However, while several mechanisms can explain this 11-year modulation as well as temperature variations prior to the 20th century, recent climate change remains much more difficult to reproduce. A large majority of scientists today believe that the solar contribution, although real, has become secondary to anthropogenic effects.
In this study, one of the major challenges is to compensate for our glaring lack of direct observations by going back in time with solar activity tracers. The number of sunspots is one of the very few direct measurements of activity that covers more than a century; its first regular observations date back to 1610. Among the most reliable indirect tracers are cosmogenic radioisotopes. The figure below illustrates the reconstruction of total irradiance from C14 and shows that the Sun has recently experienced a phase of renewed activity. The last solar cycle, which should end in 2010, was however exceptionally long and calm; this is a boon for those seeking to understand and model the internal dynamics of our star.
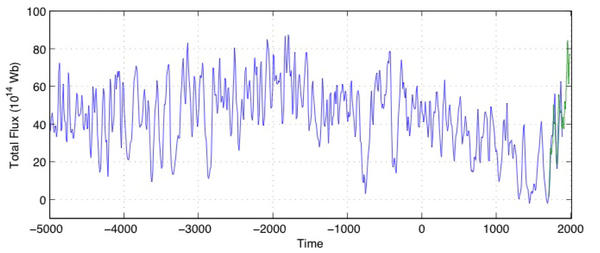
The reconstruction of the open magnetic flux emitted by the Sun. The total irradiance is proportional to this flux, which is deduced here from the C14 production rate. The green curve represents a direct measurement of the flow and the time axis is expressed in years. Figure from: L. Vieira & S. Solanki, Evolution of the solar magnetic flux on time scales of years to millenia, Astronomy & Astrophysics (2010).
- E. Bard and M. Frank, Climate change and solar variability: What’s new under the Sun? Earth and Planetary Science Letters 248, 1-14 (2006).
- T. Dudok de Wit and J. Watermann, Solar forcing of the terrestrial atmosphere, Comptes-Rendus Geoscience 342 (2009), sous presse.
- J. D. Haigh, The Sun and the Earth’s Climate , Living Reviews in Solar Physics 4, 2-65 (2007).
- E. Nesme-Ribes et G. Thuillier, Histoire solaire et climatique, Editions Belin (2000).
- G. Usoskin, A History of Solar Activity over Millennia , Living Reviews in Solar Physics 5 (2008).


