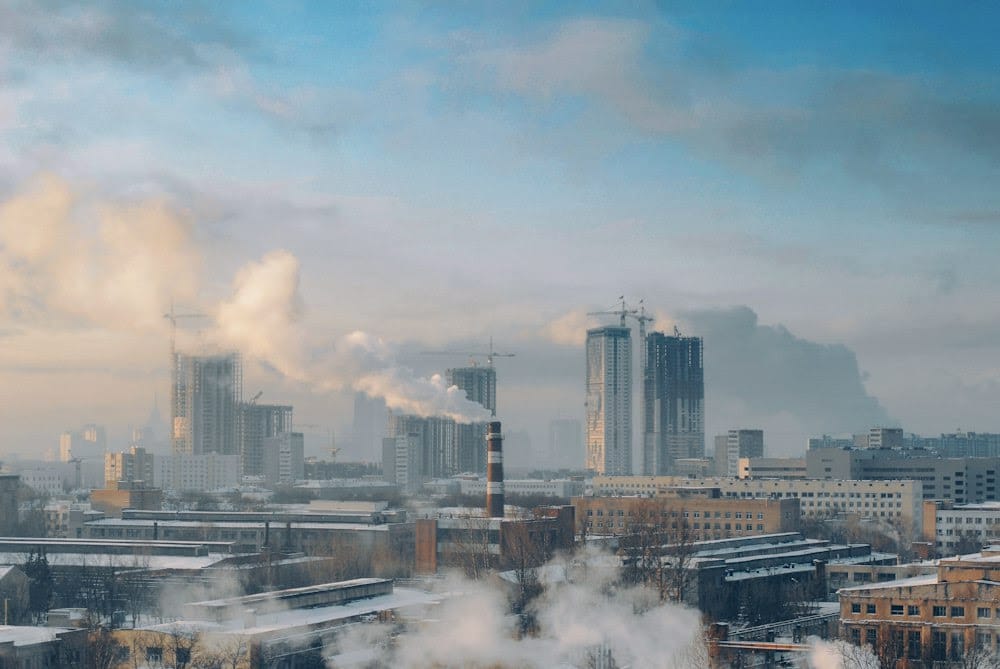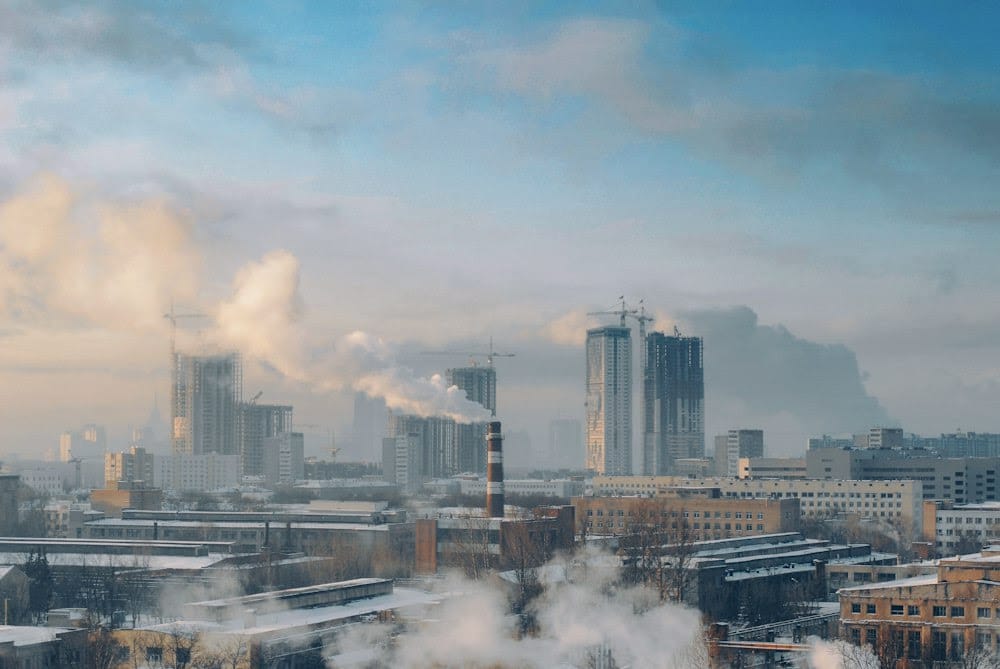
The degree of pollution is generally measured by taking into account the level of particulate matter present in the atmosphere, from solid carbon compounds, unburned hydrocarbons, tire wear and heavy metals.
Air pollution calculations distinguish between two main particle sizes: PM10 and PM2.5 particles smaller than either 10 microns or 2.5 microns.PM10 are respirable particles emitted by exhaust pipes and road traffic, such as road wear, tires, brake and clutch linings, coal and heavy fuel oil combustion, nitrogen fertilizers used in agriculture and asbestos fibers.
PM2.5 are finer particles that can penetrate the lungs. These are mainly the particles emitted by diesel vehicles, originating from sulphur and heavy metals, or the microsud particles produced by the combustion of kerosene, gas, gasoline and light fuel oil.
The benchmark regularly used to compare air quality is the air quality index, AQI, which is represented by a scale of values ranging from 0, the best, to 500, the worst. This index integrates various pollutants, including PM2.5 and PM10.
https://www.airnow.gov/aqi/aqi-basics/
The British firm Utility Bidder has drawn up a ranking of the 100 most polluted cities in 2021, taking into account the concentration of PM2.5 particles, measured by the AQI, the percentage of traffic jams and the level of CO2 emissions per capita in tons of CO2 equivalent, MtCO2e :
Air pollution

Lima-Peru
Lima, Peru, with an IQA of 187 out of 500
Bogotá, Colombia, with a traffic congestion rate of 53%.

Santiago-Chile
Santiago, Chile, with an AQI of 161
Rotterdam in the Netherlands, with emissions of 51 MtCO2e
Mexico City, Mexico, with an AQI of 121 and a traffic congestion rate of 36%.
Jakarta, Indonesia
Jakarta, Indonesia, with an AQI of 105 and a congestion rate of 36%.
Las Vegas, USA, with emissions of 48 MtCO2e
Tao yuan, Taiwan, with an AQI of 50 and a traffic congestion rate of 34%.
Kaohsiung, Taiwan, with an IQA of 31 and a traffic congestion rate of 32%.
Hamilton, Canada, with an IQA of 76 and emissions of 32. MtCO2e


