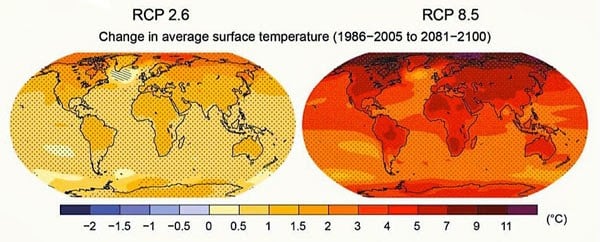
This table gives us 2 extreme IPCC possibilities (the most [RCP2.6] and the least [RCP8.5] ambitious in terms of greenhouse gas emission reductions) for global surface warming by the end of this century compared with the period 1986-2005. The range of colors clearly indicates regional differences (higher warming in the Northern Hemisphere and very marked warming at the North Pole) and illustrates the fact that long-term land surface warming will be higher than ocean surface warming.
The RCP2.6 scenario is the only one likely to keep global warming below 2°C, and implies, in the relatively short term, substantial reductions in anthropogenic greenhouse gas emissions:
By 2030: emissions around 20% below 2010 levels
By 2075: no net emissions


